Hubbard Radio Washington DC, LLC. All rights reserved. This website is not intended for users located within the European Economic Area.
A decade ago today, the US stock market was hitting rock bottom. The Great Recession, which had been in effect for almost two years, showed no signs of getting ...
Do you remember what you were doing, what you were feeling 10 years ago?
You probably don’t want to remember, but maybe you should?
Well if you were a fed, active or retired, and you were tracking your Thrift Savings Plan balance you were probably not too happy. If you were retired you wondered if you would have enough money to last. If you weren’t retired, there’s a good chance you were thinking maybe you never could retire.
That’s because 10 years ago today — give or take a couple leap days — the US stock market was hitting rock bottom. The Great Recession, which had been in effect for almost two years, showed no signs of getting better — ever.
Tens of thousands of federal investors, active and retired, had by now pulled some, most or all of their money out of falling shares in the stock-indexed C, S and I funds. Most people who fled the market moved into the treasury securities G-fund. Many stopped investing in the stock-indexed funds (which, it turns out, were on sale). Some people are still mostly or exclusively in the G-fund even though the C, S and I funds have far outpaced it over the past 10 years.
As of Tuesday the Wilshire 500 Total Market Index was up 321.72 percent, or $26.5 trillion. But the market continues to jump up and down, including this week and this month. Most experts say it is long overdue for a major correction of 20 or even 30 percent.
So what will you do when that happens? Will you again head for the “safety” of the G Fund even though its average annual returns, if you are under the Federal Employees Retirement System, won’t keep up with inflation? Will you continue to buy C, S and I in hopes they are on sale, assuming they go up again in value? Can you “time” the market, know when to buy and when to sell?
The most recent Wilshire Factoid list has good news and bad, depending on which dates you check out. And that’s a good thing to remember when you are in a long-haul investment project like saving for retirement.
The Wilshire 5000 Total Market Index (W5000) closed today at 28,686.64, down -236.47 points or -0.82 percent. This represents a paper loss for the day of approximately $250 billion.
The Wilshire 5000 fell for the third day in a row and the fourth time in the past five trading days. This is the longest losing streak of 2019 and the longest string of negative days since Dec. 24 concluded with eight negative days in a row.
The Wilshire 5000 had a three-day loss of –415.99 points, or -1.43 percent, for a paper loss of approximately $425 billion.
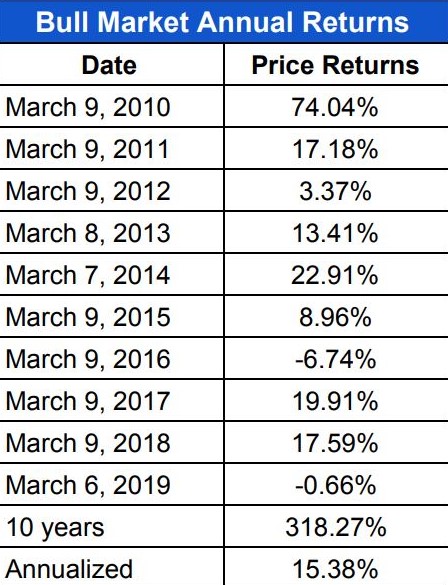
Saturday is the 10-year anniversary of the Wilshire 5000’s Financial Crisis low of March 9, 2009, and since then it is up 318.27 percent or $26.2 trillion. The annual price returns on each anniversary date in the subsequent bull market are in the chart below.
For the month, the Wilshire 5000 is down -0.75 percent or approximately $225 billion.
For the quarter, the Wilshire 5000 is up 11.41 percent or approximately $3.1 trillion.
Since the Dec. 24 market low, the Wilshire 5000 is up 18.78 percent or approximately $4.8 trillion.
Since Nov. 6, the close on the day of the 2018 midterm elections, the Wilshire 5000 has gained 0.77 percent or approximately $225 billion.
Since the Sept. 20 market high, the Wilshire 5000 is down -5.84 percent or approximately $2 trillion.
Since Jan. 20, 2017, the close on the day of the Trump inauguration, the Wilshire 5000 has gained 20.81 percent or approximately $5.4 trillion.
Since Nov. 8, 2016, the close on the day of the 2016 election, the Wilshire 5000 has gained 29.42 percent or approximately $7.5 trillion.
Since Dec. 15, 2015, the close before the Federal Reserve raised interest rates for the first time since June 29, 2006, the Wilshire 5000 is up 35.96 percent or approximately $8.7 trillion.
Since Sept. 12, 2012, the close before Bernanke revealed QE3, the Wilshire 5000 is up 90.75 percent or approximately $15.7 trillion.
Since Aug. 26, 2010, the close before Bernanke revealed QE2, the Wilshire 5000 is up 161.43 percent or approximately $20.4 trillion.
Since the Oct. 9, 2007, market high the Wilshire 5000 is up 81.48 percent or approximately $16.1 trillion.
By Amelia Brust
Whale sharks have more than 300 rows of teeth but they usually swallow their food whole, relying on a diet of plankton, krill, fish eggs, and small fish.
Source: Mental Floss
Copyright © 2024 Federal News Network. All rights reserved. This website is not intended for users located within the European Economic Area.

Mike Causey is senior correspondent for Federal News Network and writes his daily Federal Report column on federal employees’ pay, benefits and retirement.
Follow @mcauseyWFED