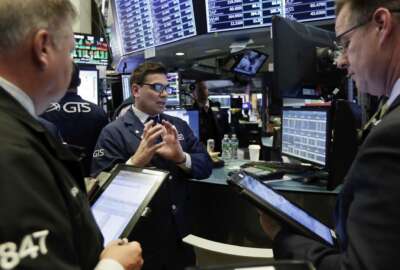
US stock market takes $125B hit Tuesday
Tracking the stock market and making long-term decisions based on day-to-day changes is not the way to build a retirement nest egg.
The U.S. stock market lost $125 billion — yes, with a “B” — on Tuesday. So what?
If you are an investor in the Thrift Savings Plan’s C and S funds, do you jump for joy when the market is up? Does that mean you made money that day?
But, by the same token, do you go into a funk when the market is down, even for a day or two? Does that mean you lost money in your long-term retirement account? The popular C and S funds cover the market and many federal or retiree investors watch them like hawks, or chickens.
If you get high or low, based on the daily or short-term performance of the stock market many experts would tell you to relax — chill out. Tracking the stock market and making long-term decisions based on day-to-day changes is not the way to build a retirement nest egg.
Case in point: The Wilshire 5000 Total Market Index (W5000) closed Tuesday at 28,360.04, which was down 109.95 points.
Pass the smelling salts. It’s terrible, right? Well, not necessarily.
According to the fund, the May 22 close means “the W5000 index fell for the third time in the past four trading days and the fourth time in the past six trading days.” OMG, you should bail out, right? Not necessarily.
Short-term returns, as most of the pros say, do not necessarily mean anything. Often neither do long-term returns which tell you what has happened but not necessarily what is going to happen in the future.
Here are some other stats on the W5000 for Tuesday, according to the popular fund itself. Analyze it, realize it happens every day, Monday through Friday, then find the trend if there is one and if you can. Here goes and good luck:
Last four months
The Wilshire 5000 Total Market Index (W5000) closed Tuesday at 28,360.04, down -109.95 points or a loss of 39 percent. This represents a paper loss for the day of approximately $125 billion.
The fund fell for the third time in the past four trading days and for the fourth time in the past six trading days. Meanwhile the fund is up 3.05 percent or approximately $925 billion for the month.
The Wilshire 5000 index is up 3.49 percent or approximately $1.1 trillion for the quarter, and up 2.10 percent or approximately $650 billion for the year.
Since the Jan. 26 market high, the fund is down 4.71 percent or approximately $1.6 trillion. By comparison, it is up 5.85 percent or approximately $1.7 trillion since the April 2 market low.
Last 18 months
The Wilshire 5000 index has gained 19.44 percent or approximately $5.1 trillion since President Donald Trump’s inauguration Jan. 20, 2017. The fund gained 27.95 percent or approximately $7.1 trillion since Election Day 2016.
Last six years
Since Dec. 15, 2015, the close before the Federal Reserve raised interest rates for the first time since June 29, 2006, the Wilshire 5000 index is up 34.41 percent or approximately $8.3 trillion. And ever since Sept. 12, 2012, the close before former Federal Reserve Chairman Ben Bernanke revealed QE3, the Wilshire 5000 index is up 88.58 percent or $15.3 trillion.
Last 10 years
Compared to Aug. 26, 2010, the close before Bernanke revealed QE2, the Wilshire 5000 index is up 158.45 percent or $20.0 trillion. The fund is also up 313.51 percent or $25.8 trillion from the Great Recession low of March 9, 2009.
And finally, the fund is up 79.42 percent or $15.7 trillion since the Oct.9, 2007, market high.
Nearly Useless Factoid
By Amelia Brust
Volcanic pumice is the only rock that can float in water. It is porous due to hot gases forming bubbles as they furiously exit the rock to cool it.
Source: Livescience
Copyright © 2025 Federal News Network. All rights reserved. This website is not intended for users located within the European Economic Area.
Mike Causey is senior correspondent for Federal News Network and writes his daily Federal Report column on federal employees’ pay, benefits and retirement.
Follow @mcauseyWFED


