TSP participant satisfaction rebounds slightly in 2024 survey
A new survey found that TSP participant satisfaction is at 84%, a 2% increase over last year’s results from the Federal Retirement Thrift Investment Board.
More participants are content with the Thrift Savings Plan, as TSP satisfaction rates indicate a slight rebound for 2024 compared with last year.
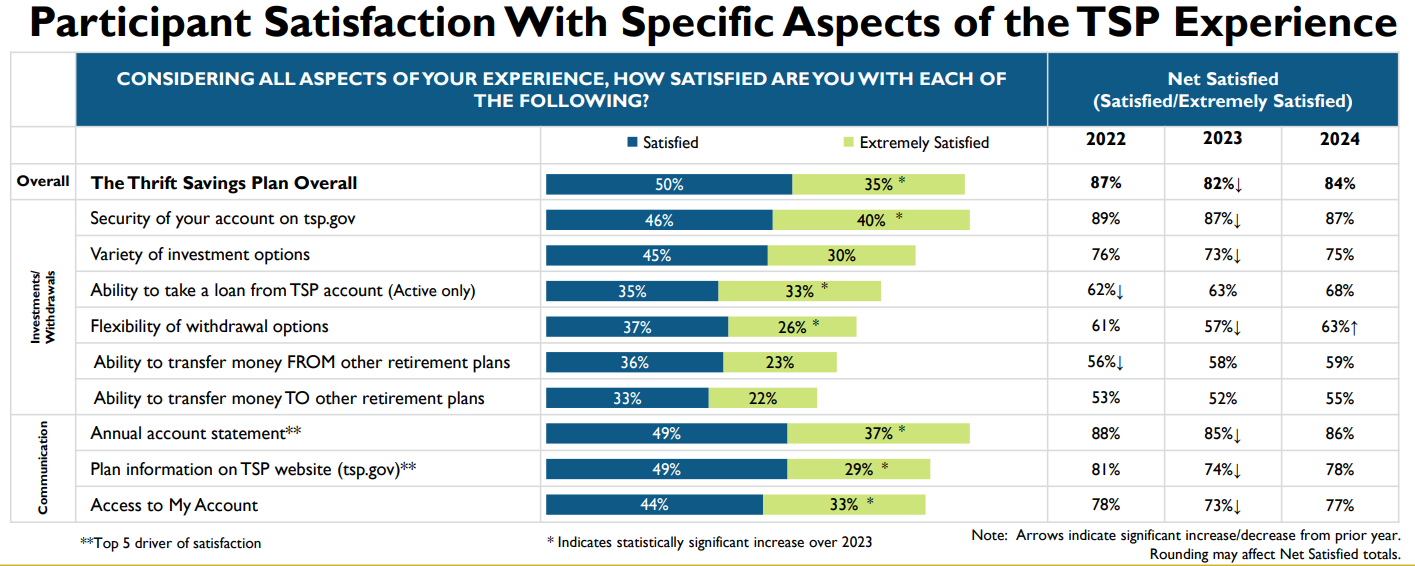
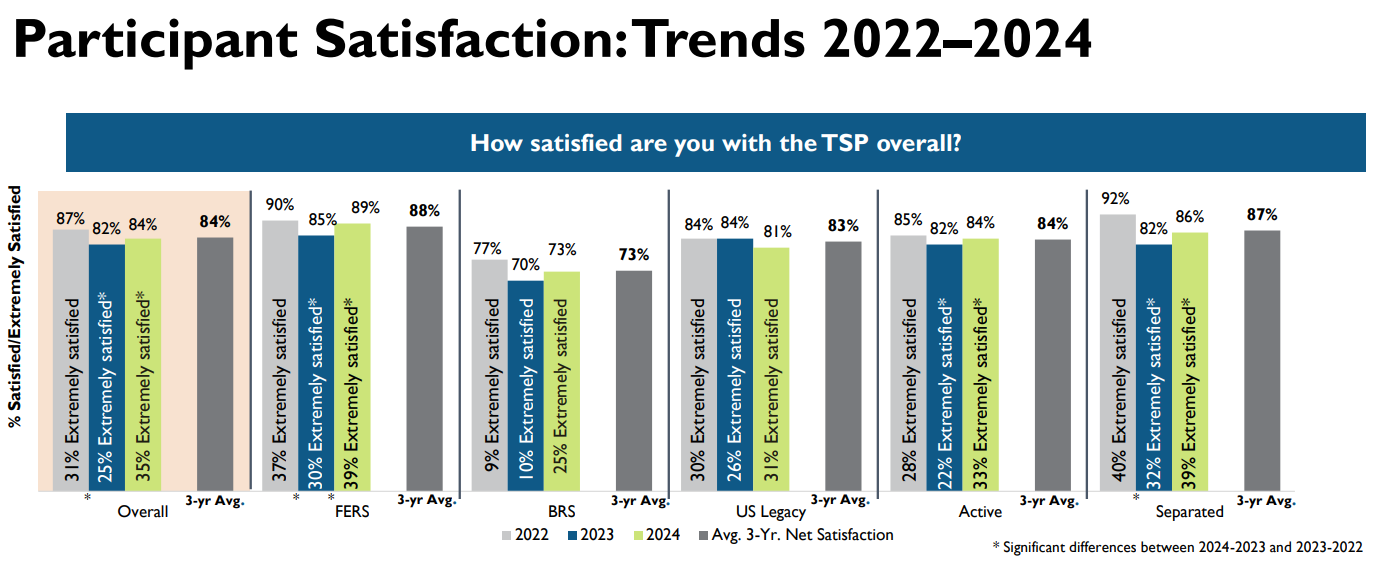
Participants’ satisfaction with the TSP is now at 84%, according to the results of the latest survey from the Federal Retirement Thrift Investment Board. The finding amounts to a 2% increase since last year’s survey results but remains a few percentage points below the 87% satisfaction rate in 2022.
The average rise in satisfaction from the thousands of participants who took FRTIB’s annual survey is in part due to increases across a majority of the features that FRTIB measures. A larger share of survey respondents also said they were “extremely satisfied,” rather than “satisfied,” with many of the TSP’s offerings, compared with 2023 survey results.
In particular, TSP participants were more highly satisfied this year with the flexibility of withdrawal options and the ability to take a loan from their account. Those two features of the government’s retirement savings program have seen changes in the time since the last satisfaction survey was conducted. For instance, FRTIB launched a “loan tracker” in October 2023, allowing TSP participants to get a step-by-step look at the processing of their loan applications.

Thomas Brandt, the FRTIB’s director of planning and risk, said participant balances and market performance also generally influence satisfaction with the TSP. And in 2024, the market has done “relatively well” he said, likely contributing to the higher satisfaction levels.
“That’s a really strong indication of the overall level of satisfaction with the plan, and it’s [pleasing] to see the increases year over year,” Brandt said Tuesday during a board meeting.
TSP participants are also showing more satisfaction with being able to track and manage their investments, make an account transaction, find the information they’re looking for, and navigate the TSP’s website. Satisfaction with each of those aspects increased by 5% or 6% between 2023 and 2024.
TSP survey “critical” to long-term strategy
Each year, FRTIB conducts a satisfaction survey to understand where participants are content with the TSP’s offerings, and where there’s room for specific improvements. The board collected responses for its 2024 survey between March and May this year.
“We don’t just produce the report and share it here,” Brandt said. “We do use this [survey] in a variety of different venues — like when we meet with the leadership team at our retreat [and] when we do our work on the annual operating plan.”
It’s also one of the most “critical” items that the board reviews when putting together the agency’s long-term strategic plans, Brandt added.
“Many of the things that they indicate we could do better are things that we are offering,” Brandt said. “But it is helpful to understand where their interests are and take this into consideration when [making] updates or enhancements.”
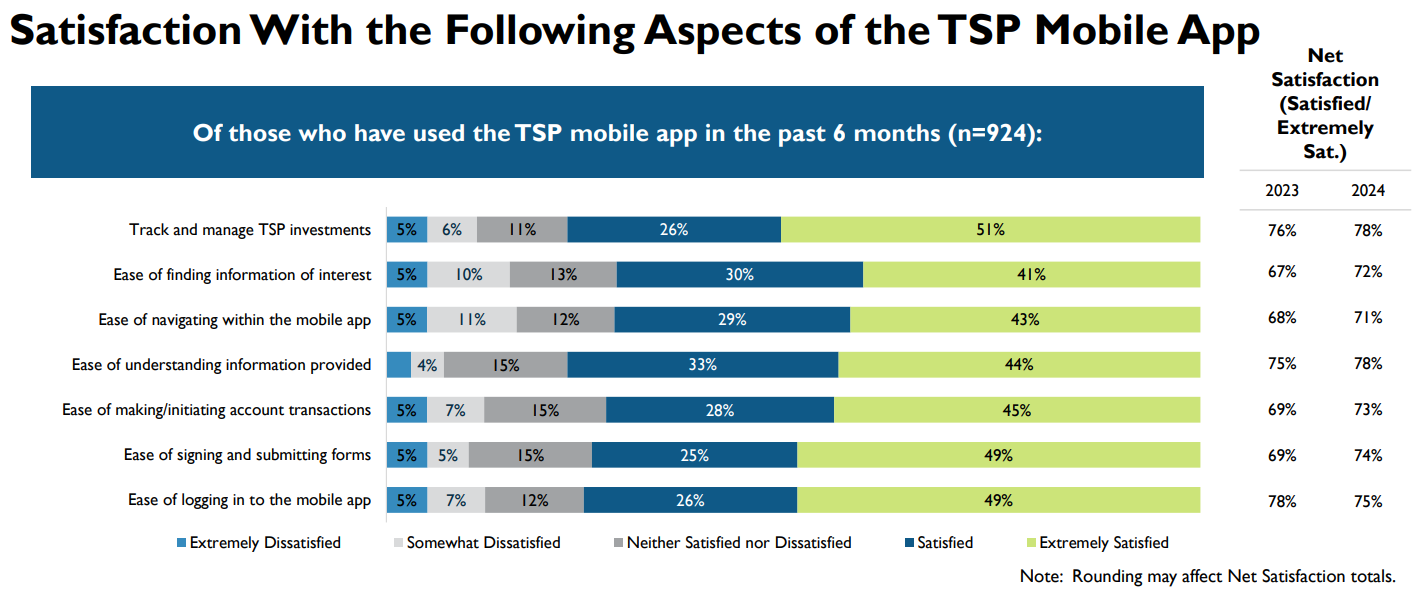
For instance, the board is paying close attention to the survey results on how participants view the relatively new TSP mobile app. In the 2024 survey, respondents rated various aspects of the mobile app more highly than they did in last year’s survey.
All but one category — the ease of logging into the app — showed an increasing trend in how satisfied participants were with what the mobile app offers.

Still, enhancing the mobile app and expanding its features will be a key area of focus for the FRTIB going forward, after getting feedback from participants through the survey.
When asked about the most important aspect of the TSP that FRTIB could improve, 11% of survey respondents also said they wanted better instructions, information and tutorials on the TSP.
BRS trends upward, but still lagging
Similar to recent past surveys, service members who are enrolled in the Blended Retirement System (BRS) are notably less satisfied with the TSP than enrollees in other retirement systems, like the Federal Employees Retirement System (FERS).
Overall, though, satisfaction with the BRS trended upward in the 2024 survey. One quarter of BRS participants said they were “extremely satisfied” with the TSP, resulting in an average satisfaction rate of 73%. That’s compared with a 70% BRS satisfaction rate last year, when just 10% of BRS participants said they were “extremely satisfied.” The 73% satisfaction rate is also 16% lower than that of FERS participants, who had an 89% rate in the 2024 survey.

BRS, a retirement program created for military members, offers a blend of two major sources of retirement income: a traditional pension and a TSP account. In the 2024 survey, BRS participants said they were most dissatisfied with the flexibility of withdrawal options, but they had the highest satisfaction rates for the TSP mobile app.
When analyzing the survey results, Brandt noted that it’s important to consider the age of participants in each of the retirement systems. For example, 80% of BRS participants separate from the TSP by age 36, in contrast with FERS employees, 60% of whom are still enrolled at age 60.
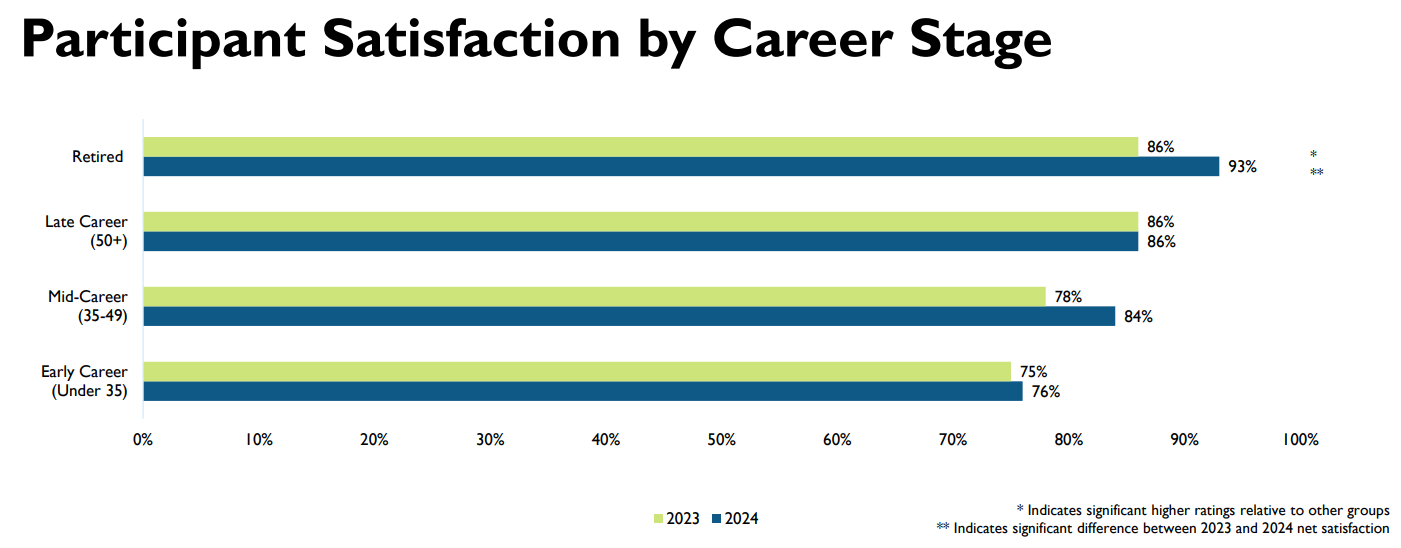
Those figures are especially relevant as satisfaction with the TSP varies significantly by the age of a participant. In 2024, retired participants reported a 93% satisfaction rate with the program, while early-career employees under 35 years old had just a 76% satisfaction rate.

“When we think about those populations, I think demographics and other indicators may help us understand a little bit of the difference in satisfaction,” Brandt said.
TSP satisfaction with ThriftLine rising
The 2024 survey also showed promising results for satisfaction with ThriftLine, the TSP’s customer service center. Satisfaction declined significantly following FRTIB’s tumultuous 2022 update and the rollover to a new recordkeeping contract. But by now, participants are once again giving higher scores to ThriftLine.
That trend has only improved further in the results of the 2024 satisfaction survey. A larger share of respondents said they’re “extremely satisfied” with the call center’s customer service, rather than “satisfied.” Participants’ satisfaction particularly trended upward based on the amount of time a participant had to wait on the phone to speak with a representative, as well as a representative’s ability to address a participant’s needs and answer their questions.
The FRTIB’s survey also comes just after the Office of Personnel Management released the results of its biannual Federal Employee Benefits Survey (FEBS). In OPM’s survey from 2023, employees ranked the TSP most highly of any federal benefit, with 96% of respondents saying it was “important” or “extremely important” to them.
Copyright © 2024 Federal News Network. All rights reserved. This website is not intended for users located within the European Economic Area.
Drew Friedman is a workforce, pay and benefits reporter for Federal News Network.
Follow @dfriedmanWFED


