For the second month in a row, most Thrift Savings Plan funds posted negative returns in September, with the exception of the government securities investment G...
For the second month in a row, most Thrift Savings Plan funds posted negative returns, with the exception of the government securities investment G fund, which again posted returns of 0.35%.
While returns remained negative in September, the funds remain in the black for the year-to-date, with the common stock index C fund still posting the highest year-to-date returns at 13.05%. This is, however, down from last month’s 18.71% Meanwhile the international stock index I fund has the highest returns over the last 12 months at 26.50%.

The small cap stock index S fund returned -4.90%, marking the worst return for the month.
In a change from last month, the fixed income F fund is showing positive returns over the last 12 months. However the fund continued to show negative returns in the year to date with -1.05% returns in September.
All other funds continue to operate in the black for year-to-date returns.

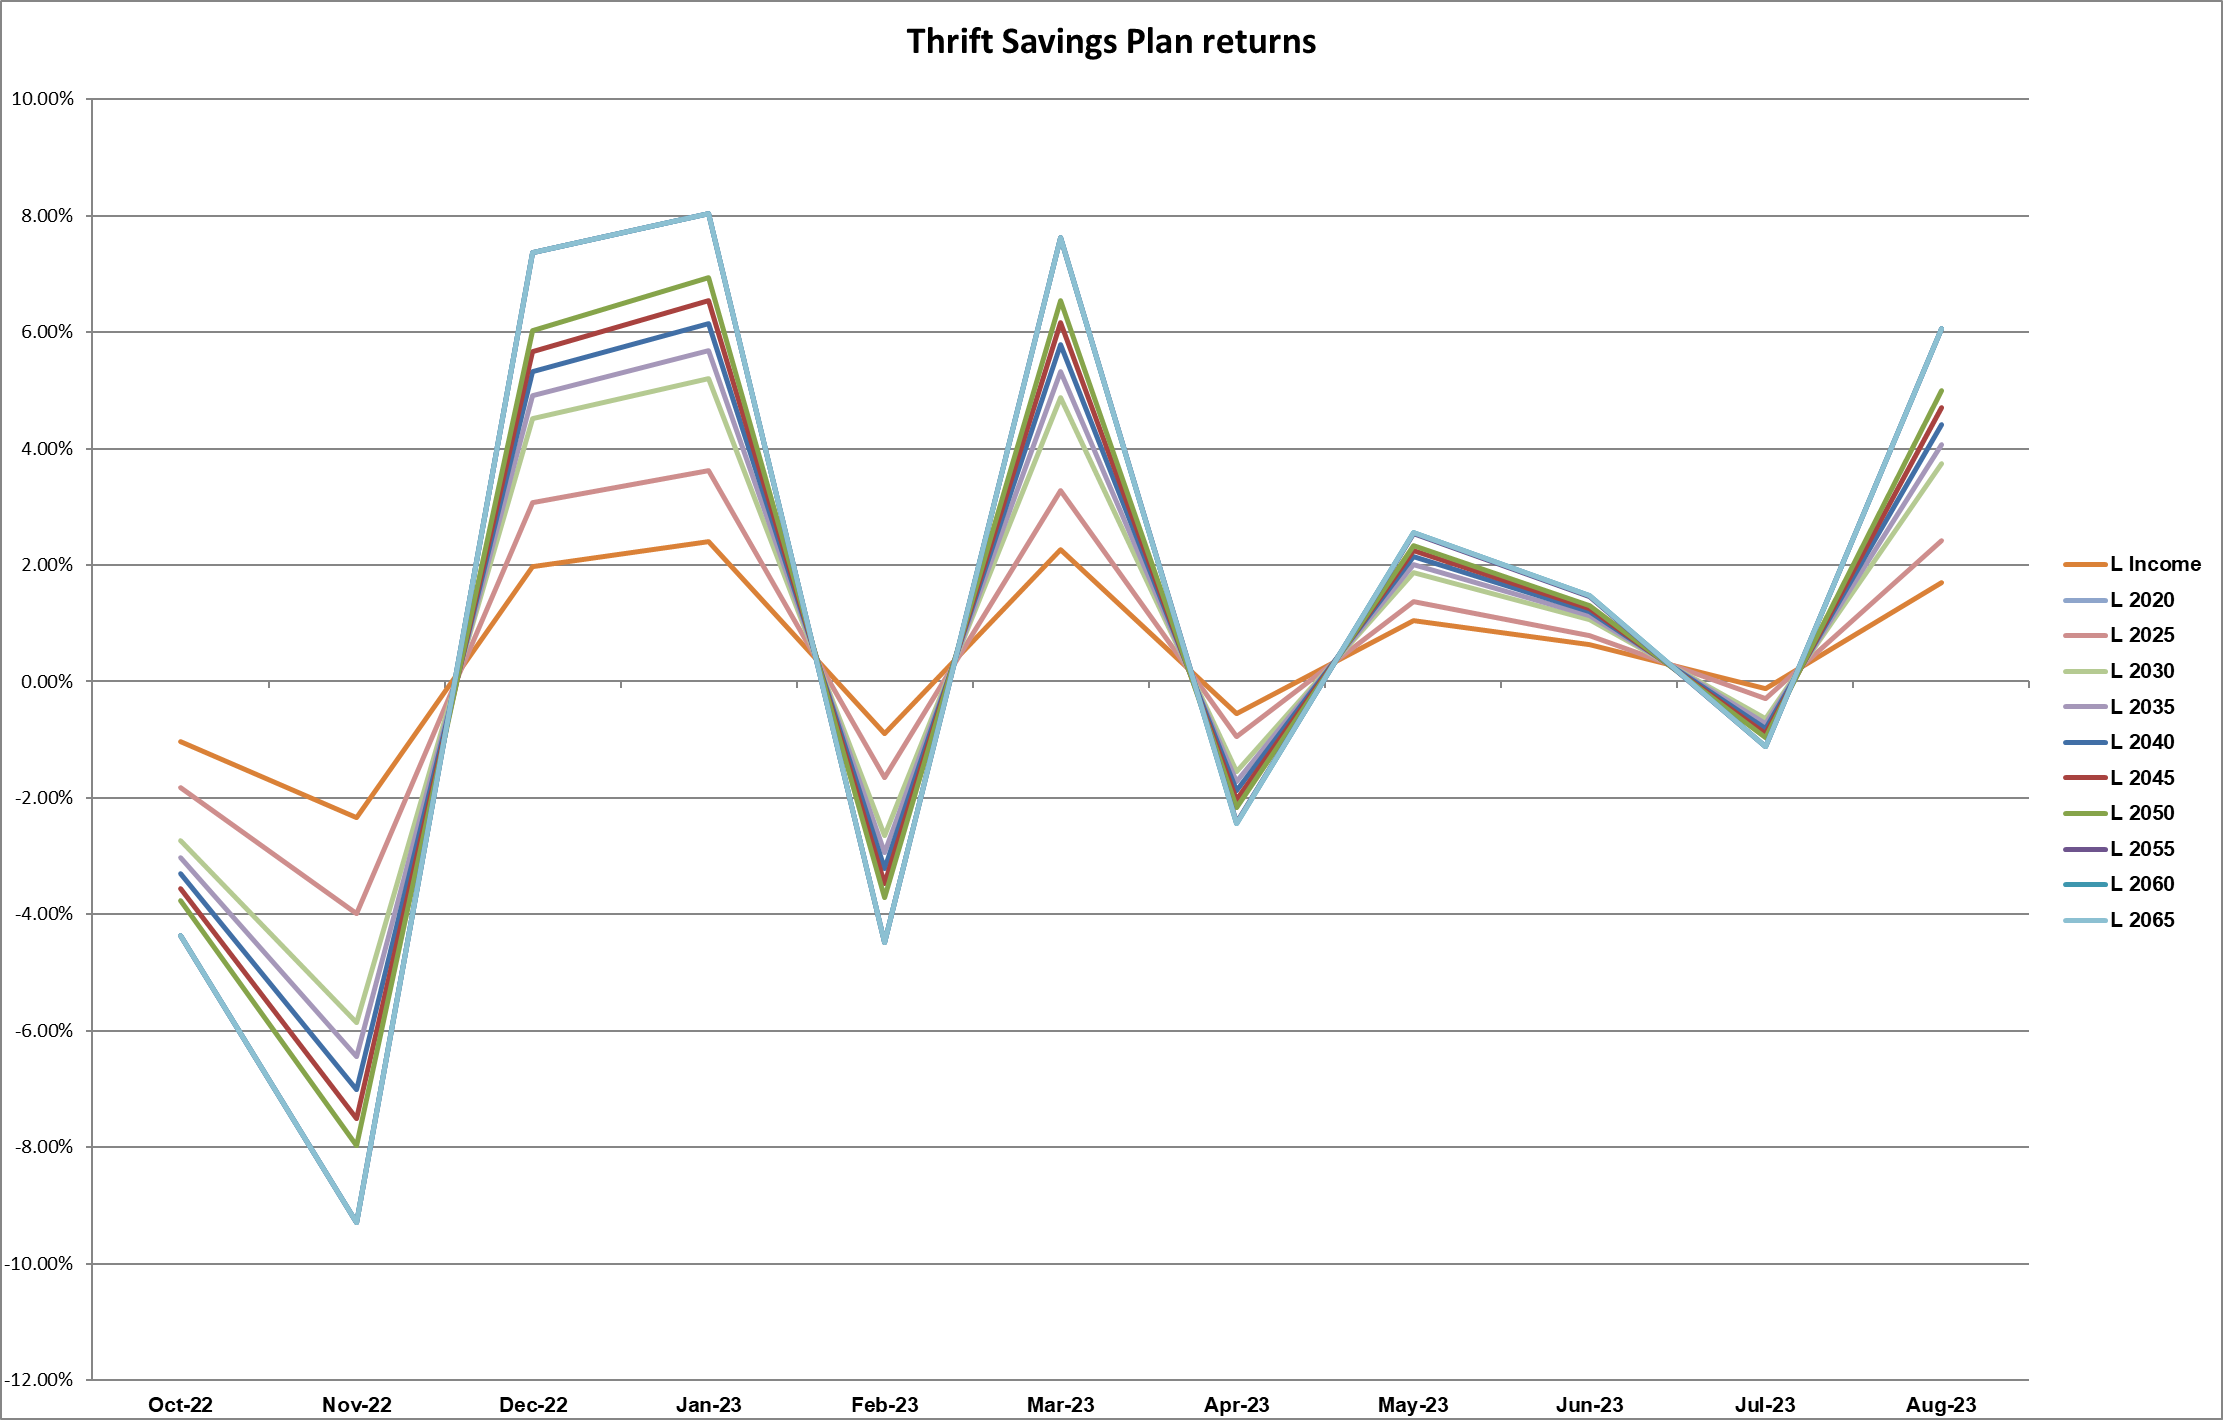
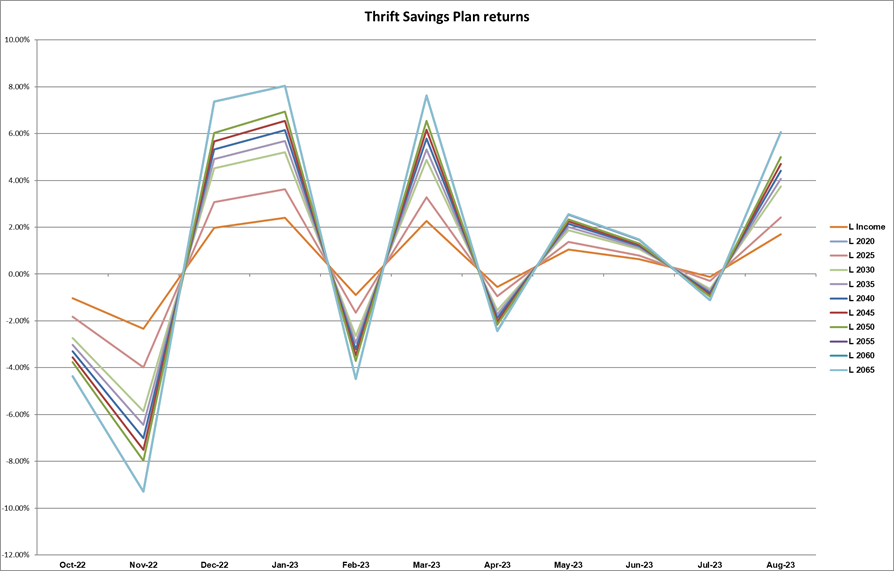
All Lifecycle funds are in the red for the second month, but remain in the black for the year, and the last 12 months.
| Thrift Savings Plan — August 2023 Returns | |||
|---|---|---|---|
| Fund | September | Year-to-Date | Last 12 Months |
| G fund | 0.35% | 2.98% | 4.03% |
| F fund | -2.54% | 1.05% | .66% |
| C fund | -4.77% | 13.05% | 21.57% |
| S fund | -4.90% | 8.84% | 14.42% |
| I fund | -3.51% | 6.94% | 26.50% |
| L Income | -1.00% | 4.65 | 5.75% |
| L 2025 | -1.53% | 5.75% | 11.08% |
| L 2030 | -2.66% | 7.32% | 14.90% |
| L 2035 | -2.96% | 7.70% | 15.93% |
| L 2040 | -3.24% | 8.11% | 16.98% |
| L 2045 | -3.48% | 8.45% | 17.86% |
| L 2050 | -3.71% | 8.81% | 18.78% |
| L 2055 | -4.31% | 10.34% | 22.23% |
| L 2060 | -4.31% | 10.33% | 22.22% |
| L 2065 | -4.32% | 10.33% | 22.22% |
Copyright © 2025 Federal News Network. All rights reserved. This website is not intended for users located within the European Economic Area.
Michele Sandiford is a digital editor at Federal News Network.
