FEMA looks to build trust in data sharing after IG found it ‘overshared’ records
FEMA's goal of strengthening its financial transparency stems from the agency’s 2018-2022 strategic plan, which seeks to improve grants management and improve...
Thinking beyond its immediate response to disasters, the Federal Emergency Management Agency is taking steps to get its data in the hands of other agency officials.
The goal of strengthening its financial transparency stems from the agency’s 2018-2022 strategic plan, which seeks to improve grants management and improve data analytics.
Amber Noel, the analysis and communications branch chief for FEMA’s Enterprise Analysis Division said the agency is modernizing its data infrastructure through its Enterprise Data Analytics Modernization Initiative (EDAMI), which seeks to replace the agency’s current analytics platform.
Noel, speaking Tuesday at a webinar hosted by Tableau, said the data modernization initiative will also make it easier for FEMA to ingest and share data from partner agencies.
“We do a lot with the Army Corps of Engineers, especially in the aftermath of major disasters like hurricanes or earthquakes, where we need to remove debris from roads so that people can travel again or they disperse the generators so that there’s power. And they need to know where the generators are, how long they’ve been there, when are they going to need more gasoline? We help with all of those things.”
The financial transparency initiative builds off the momentum of projects like USASpending.gov and goes beyond the scope of what FEMA reports to Congress strictly on disaster relief.
This project also looks at FEMA’s portfolio of non-disaster work, which includes preparedness grants, and pre-disaster mitigation.
Noel said FEMA envisions building a platform that drills down into the agency’s state and county-level spending.
“We wanted to make something that is both user-friendly, but then also informative and that can answer all of these questions,” she said.
The agency has also launched FEMA by the Numbers, a dashboard that provides visualization of the agency’s more asked-about data. The agency officials check the dashboard quarterly and update the chief points of contact for the data sets.
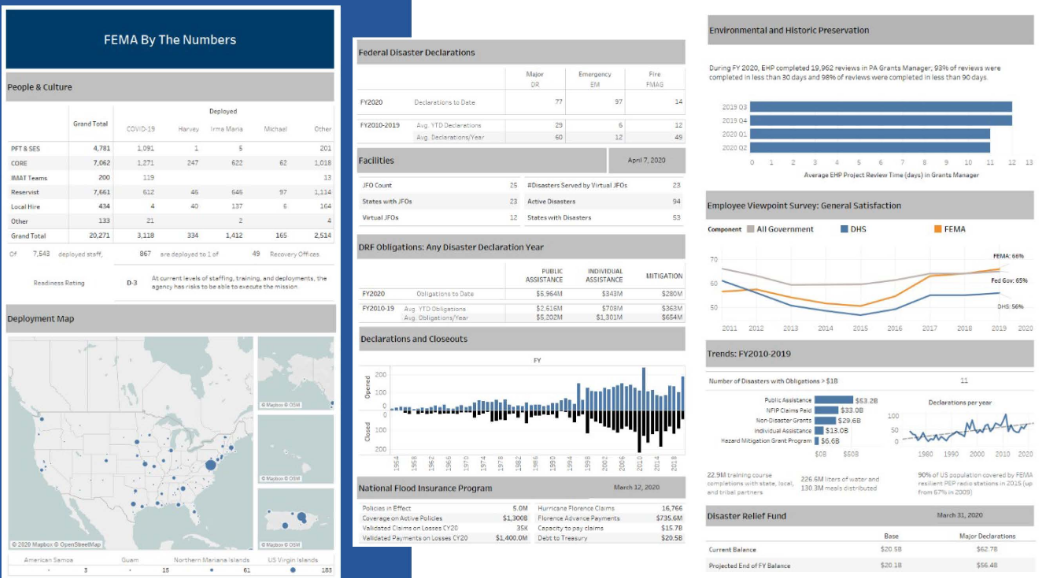
During its initial outreach with agency program areas, FEMA identified more than 300 critical questions about the agency’s data.
“It runs the gamut, we see things like how many disasters have we declared so far this year, how many people are out in the field right now? We also have human capital questions, financial questions, how much money have we outlaid on certain program areas so far this year,” Noel said.
While outlined in the agency’s current strategic initiative, the inception of this data modernization stems from the FEMA’s rundown of lessons learned in the aftermath of Hurricane Sandy, which highlighted what Noel said was the “need to have some sort of common analytic product that could be used for planning and analysis during that operational period.”
Those same recommendations were repeated in a 2013 cost management information session, and a year later led to FEMA developing an interactive “common operating picture” of its data.
“People could go and interact with it. They could look at disasters that happened in a given year, or a given kind of a disaster — just earthquakes, just hurricanes. Only things that happened in Florida, or only things that happened in Texas, and be able to see things like the amount of financial resources that were expended, how long it took after the initial incident period until all the funds were fully expended,” Noel said.
Over the past few years, the data behind these visualizations has only gotten more robust. In 2016, the common operating picture ran on about 50 different data sets, but as of last year, it runs on more than 1,500 data sets.
“This really put decision-making in the hands of the users. They were able to drive it, they were able to dive in, look at what they needed to see. And they didn’t have to manipulate really big Excel files. They didn’t have to try and download multiple Excel files and then do a pivot or do a filter. It was all right there, it was much more user-friendly for them,” Noel said.
On a given week, FEMA gets about 400 unique users and 22,000 hits to its Tableau server, but those numbers spike during a disaster, such as the 5.5-magnitude earthquake that struck Puerto Rico earlier this year.
FEMA’s pushed for data-driven decision-making started with the Foundations for Evidence-Based Policymaking Act. which President Donald Trump signed into law in January 2019. But later that year, in July, acting FEMA Administrator Peter Gaynor signed a data-sharing directive that, Noel said, put data sharing “at the forefront of everybody’s mind.”
Central to both the law and the directive is the imperative to presume data sets are shareable with public and private partners, unless there are statutory limits on sharing that information.
That allows FEMA to share its data with, for example, Red Cross officials responding to a hurricane and seeking survivors, but also prohibits the sharing of personally identifiable information in ways that jeopardize security.
However, FEMA has also had to account for an inspector general report in March 2019 that found the agency had “unnecessarily overshared” the sensitive, personally identifiable information of more than 2 million disaster survivors with a contractor that supports the agency’s Transitional Sheltering Assistance (TSA) program.
“We need to do it in a way that is secure, so that there is no compromise in the privacy, there’s no risk that list of survivors ends up for sale on some nefarious website, but we also need to do it rapidly,” Noel said. “It’s not helpful to a survivor if it takes six months for their name to come to a list of apartments that are available. We need that to occur relatively rapidly, so we need to be mindful of both of those things.”
Both policies also place a premium on linking up interoperability between data sets to provide greater insights from data across the federal government, as well as data held by the private sector.
“We have a lot of information about flood risks, about mitigation,” Noel said. “Perhaps someday, just like there’s a walkability score on real estate websites like Redfin or Zillow, maybe someday we’ll see a flood-risk score when people are looking at new properties, and that really helps people make a more informed decision about where they choose to live.”
Copyright © 2024 Federal News Network. All rights reserved. This website is not intended for users located within the European Economic Area.


Jory Heckman
Jory Heckman is a reporter at Federal News Network covering U.S. Postal Service, IRS, big data and technology issues.
Follow @jheckmanWFED