S fund posts negative returns in April; all other TSP funds in the black
For the second month in a row, every TSP fund except the small cap stock index S fund posted positive returns.
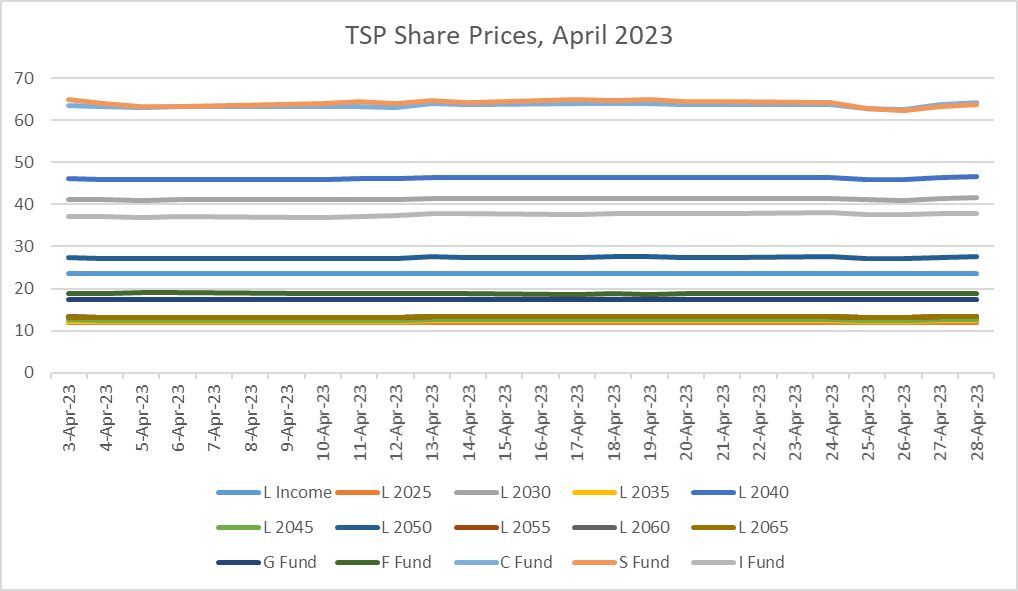
For the second month in a row, every TSP fund except the small cap stock index S fund posted positive returns. The S fund came in at -2.18% in April, with share prices dropping from $64.96 to $63.71. That also leaves it as one of only two funds to post negative returns across the last 12 months — -5.94% — though it’s still up overall in 2023, with a year-to-date return of 3.54%.
The other fund with negative year-to-date returns is the fixed income index F Fund. However, two months of positive returns have almost brought it into the black — it currently sits at -0.25% over the last 12 months. But April was its second month of positive returns, posting 0.60%, bringing its year-to-date up to 3.76%.

The international stock index I fund posted the highest returns in April, albeit with a rather modest 2.87% return. That also leaves it with the highest returns over the last 12 months — 10.19% — and the highest in 2023 so far, at 11.74%.
Meanwhile, the ever-dependable government securities investment G fund plays the tortoise to the I fund’s hare, plodding along steadily with 0.30% returns in April, bringing its total returns in 2023 so far up to 1.26%. That’s just over one-third of its total performance over the last 12 months, at 3.62%.
The common stock index C fund had the highest share price at the end of the month, at $64.30 per share. Thanks to a 1.56% return in April, it’s up 9.16% in 2023 so far.
The Lifecycle income funds all showed positive returns in April as well, lifting them out of the red over the last 12 months.
| Thrift Savings Plan — April 2023 Returns | |||
|---|---|---|---|
| Fund | April | Year-to-Date | Last 12 Months |
| G fund | 0.30% | 1.26% | 3.62% |
| F fund | 0.60% | 3.76% | -0.25% |
| C fund | 1.56% | 9.16% | 2.62% |
| S fund | -2.18% | 3.54% | -5.94% |
| I fund | 2.87% | 11.74% | 10.19% |
| L Income | 0.63% | 3.41% | 4.08% |
| L 2025 | 0.79% | 4.54% | 3.77% |
| L 2030 | 1.07% | 6.31% | 4.29% |
| L 2035 | 1.13% | 6.80% | 4.24% |
| L 2040 | 1.20% | 7.27% | 4.20% |
| L 2045 | 1.25% | 7.68% | 4.13% |
| L 2050 | 1.31% | 8.07% | 4.08% |
| L 2055 | 1.46% | 9.27% | 4.16% |
| L 2060 | 1.48% | 9.27% | 4.15% |
| L 2065 | 1.48% | 9.27% | 4.15% |
Copyright © 2025 Federal News Network. All rights reserved. This website is not intended for users located within the European Economic Area.
Daisy Thornton is Federal News Network’s digital managing editor. In addition to her editing responsibilities, she covers federal management, workforce and technology issues. She is also the commentary editor; email her your letters to the editor and pitches for contributed bylines.
Follow @dthorntonWFED


